
5 Product Analytics Dashboards Every Product Manager Should Be Using in 2025
Why Dashboards Matter
In today’s product environment, data is more than an afterthought. It is the foundation for decisions that shape product growth, customer satisfaction, and operational efficiency. Without clear and reliable product analytics dashboards, managers risk working from guesswork rather than evidence.
At Product Siddha, we have seen teams gain clarity and save resources once they adopt well-designed dashboards. These tools not only track numbers but also highlight trends, uncover weak spots, and help managers respond quickly to real conditions.
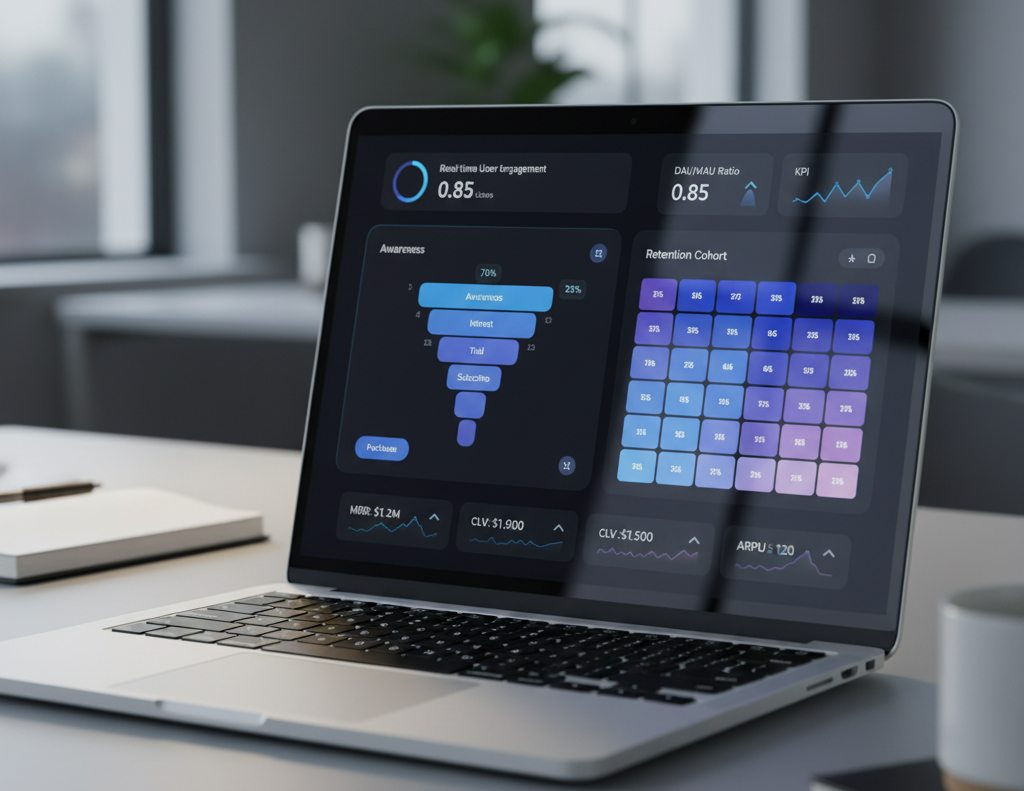
1. User Engagement Dashboard
A product succeeds only if people use it regularly. A user engagement dashboard shows how often customers interact with features, how long they stay, and what parts of the product they abandon.
Key metrics to track:
- Daily active users (DAU) and monthly active users (MAU)
- Feature adoption rates
- Session duration and frequency
In a recent Product Siddha project for a mobile commerce client, the engagement dashboard revealed that nearly 40 percent of first-time users left after the second session. By identifying this point of friction, the team simplified the sign-up process and increased retention within three months.
Engagement Metrics at a Glance
| Metric | Why It Matters | Example Insight |
|---|---|---|
| DAU/MAU ratio | Measures stickiness | 25% ratio shows room to grow |
| Feature adoption | Highlights popular vs. unused features | Low use may signal redesign |
| Session frequency | Indicates habit-forming use | High drop-off shows barriers |
2. Conversion and Funnel Dashboard
Tracking how users move from awareness to purchase (or any goal action) is central to understanding value delivery. A funnel dashboard breaks down this journey step by step.
Key metrics to track:
- Drop-off percentage at each funnel stage
- Conversion rates by device or channel
- Average time to conversion
For one SaaS platform, Product Siddha used a funnel dashboard to discover that most drop-offs occurred between the free trial and paid plan stage. A revised onboarding message improved conversions by 15 percent without adding any new features.
3. Retention and Churn Dashboard
Acquiring users is costly, so keeping them is more profitable. A retention dashboard measures how many users return over weeks or months, while churn dashboards show when and why they leave.
Key metrics to track:
- Retention cohorts by week or month
- Churn rate and its correlation with product updates
- Net promoter score (NPS) trends
A client in the financial services sector worked with Product Siddha to build a churn dashboard. The results showed a link between delayed support responses and higher cancellations. After improving support workflows, churn fell by 12 percent within two quarters.
4. Revenue and Monetization Dashboard
For managers, it is not enough to know how users behave. Understanding how those actions translate into revenue is critical. A revenue dashboard connects product usage with financial outcomes.
Key metrics to track:
- Monthly recurring revenue (MRR)
- Customer lifetime value (CLV)
- Average revenue per user (ARPU)
During an analytics engagement, Product Siddha helped an e-learning platform uncover that a small percentage of power users contributed to over 60 percent of revenue. This insight allowed the client to develop premium packages, improving margins without alienating entry-level customers.
5. Operational Performance Dashboard
Behind every product lies an operational engine of development, support, and delivery. An operational performance dashboard monitors the efficiency of these processes.
Key metrics to track:
- Development cycle time
- Bug resolution rates
- Support ticket response time
Product Siddha introduced an operational dashboard for a logistics app. By tracking development cycle time, the team spotted delays caused by manual QA bottlenecks. Automating regression tests shortened release cycles by 25 percent while reducing errors.
Putting Dashboards Into Action
A dashboard is only useful if it influences action. Product managers should:
- Review dashboards at regular intervals instead of letting data accumulate.
- Share insights across design, engineering, and marketing teams.
- Connect dashboard findings with roadmap planning.
Product Siddha emphasizes this practice during consulting engagements. In one retail project, weekly dashboard reviews aligned teams quickly, preventing costly rework and improving customer experience.
Final Thoughts
The year 2025 is shaping up to be one where product managers cannot afford to work without precise data. The five dashboards outlined above form a foundation for making reliable, evidence-based decisions.
By combining user engagement, funnel tracking, retention analysis, revenue insights, and operational monitoring, managers can see not only what customers are doing but also how their actions connect to business results.
For organizations seeking guidance, Product Siddha provides tailored analytics consulting that ensures dashboards are not just reports but living tools for growth. The lesson is simple: a good dashboard saves time, lowers costs, and improves quality all at once.