
Product Analytics for a Ride-Hailing App with Mixpanel
| Client | Ride-Hailing Mobile App |
| Service Provider | Product Siddha |
| Industry | Transportation / Mobile App |
| Service | Product Analytics Implementation using Mixpanel |
The Problem: No Clear View of How Users Book Rides
The client runs a ride-hailing app. They wanted to better understand how users moved from installing the app to completing a ride. But there were several problems:- Missing event tracking: There was no intuitive way to see what users were doing inside the app, like where they dropped off or how long it took to book a ride, without having to visit the app logs/backend.
- No organized data structure: The teams couldn’t trust the numbers because there was no proper naming or structure.
- Lack of funnel visibility: Product/Marketing team couldn’t track the full ride journey – install, sign-up, payment, and ride completion.
- Slow decision-making: Product and marketing teams were guessing instead of using real data to improve the app.
The Solution: Smart Mixpanel Setup for End-to-End Tracking
Product Siddha stepped in to create a complete product analytics solution using Mixpanel, a powerful tool for tracking user behavior. Here’s how they did it:- Full Event Tracking Plan The team designed and set up a complete event tracking plan. This plan captured all the key actions users took in the app—like signing up, selecting rides, making payments, and completing rides.
- Built a Scalable Data Taxonomy
To keep everything clean and easy to manage, a data taxonomy and schema was created. This included:
- Ride lifecycle (start to finish)
- Payments and cancellations
- User actions and traits (such as device type, location, etc.)
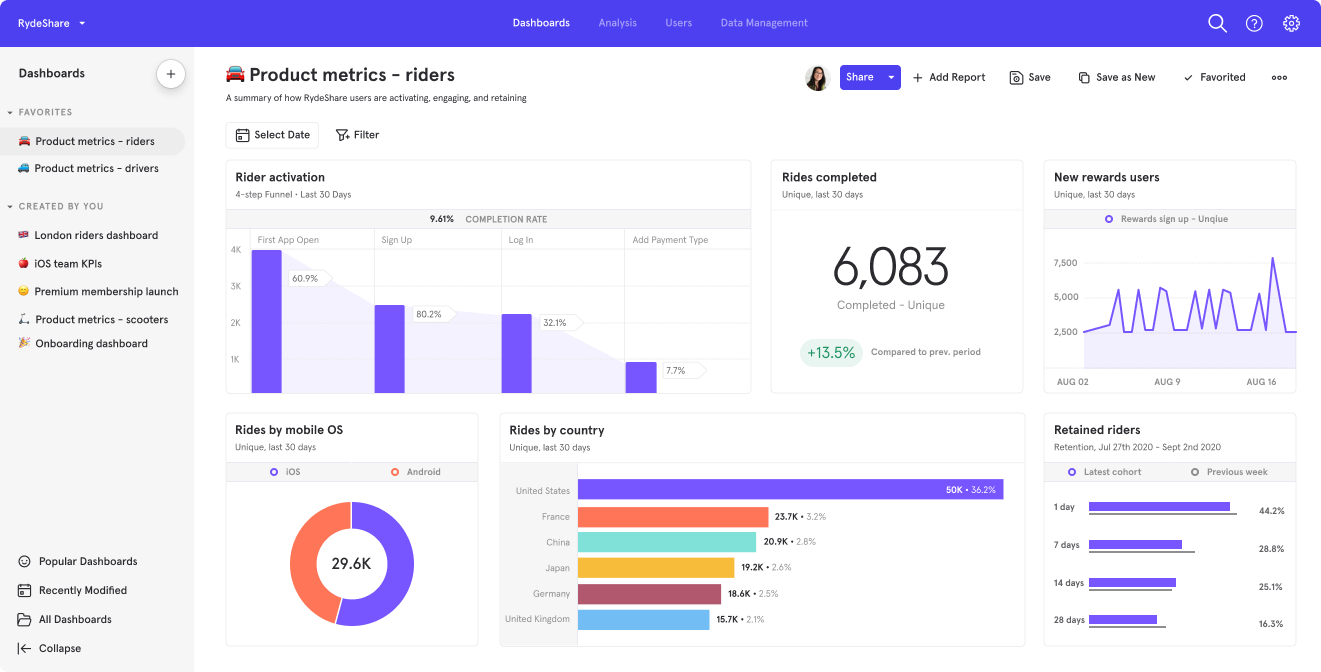
- Funnel Visibility from Start to Finish Mixpanel was set up to track the entire user journey, from app install to the first completed ride. The analytics showed exactly where users dropped off and which parts of the ride process needed fixing.
- Dashboards for Everyone Custom Mixpanel dashboards were built for each team—marketing, product, and operations. These dashboards made it easy to see real-time results and understand user behavior at every step.
The Outcome: Clear Data, Faster Growth, Better Rides
The new analytics setup gave the ride-hailing app a complete view of how users behaved. In just 30 days, the team saw big results:- +13.5% increase in funnel completion rate – More users finished the ride booking process because drop-off points were fixed.
- Faster decision-making – Teams used dashboards to track real-time trends and test new ideas.
- Improved user experience – With better data, the app was updated to match how users actually used it.
- Scalable tracking – The clean schema and taxonomy made it easy to add new features without breaking the system.