
AI Automation KPIs: How to Measure ROI Beyond Cost Savings
Looking Beyond Payroll Savings
Many AI automation projects are approved because they promise lower operating costs. Business leaders often hear statements such as “automation will save thousands of working hours” or “manual work will be reduced by 60 percent.” While these outcomes are valuable, they rarely represent the biggest return from an automation initiative.
For executives responsible for approving technology budgets, the real question is much broader.
Did the investment improve business performance?
A successful automation project should strengthen revenue generation, improve customer satisfaction, shorten business processes, reduce operational risk, and help employees focus on work that creates greater value.
This is why measuring return on investment (ROI) through labour savings alone gives an incomplete picture.
At Product Siddha, AI Automation Services are designed around measurable business outcomes. Every implementation begins with clear objectives and a reporting framework that allows leadership teams to evaluate progress using practical business KPIs rather than assumptions.
Why Cost Savings Can Be Misleading
Imagine two businesses that each invest ₹18 lakh in AI automation.
Company A
- Saves ₹5 lakh annually in staffing costs.
- No improvement in customer experience.
- Sales remain unchanged.
- Employees continue working with disconnected systems.
ROI appears modest.
Company B
- Saves only ₹2 lakh in operating costs.
- Reduces customer response time by 80%.
- Increases repeat purchases by 18%.
- Improves lead conversion by 22%.
- Generates ₹36 lakh in additional annual revenue.
Although Company B saved less money directly, its automation project produced significantly greater business value.
This illustrates why modern AI projects should be measured using operational and commercial KPIs instead of payroll reductions alone.
The ROI Formula Every Executive Should Understand
Many organisations make ROI calculations unnecessarily complicated.
A practical approach is:
ROI (%) = (Total Business Value − Total Investment) ÷ Total Investment × 100
Example
An organisation invests:
| Investment | Cost |
| AI Automation Implementation | ₹9,00,000 |
| Software Licences | ₹4,00,000 |
| System Integration | ₹3,00,000 |
| Employee Training | ₹2,00,000 |
Total Investment = ₹18,00,000
After twelve months, measurable business gains include:
| Business Outcome | Annual Value |
| Additional Revenue | ₹28,00,000 |
| Operational Savings | ₹6,00,000 |
| Fewer Processing Errors | ₹4,00,000 |
| Faster Customer Onboarding | ₹5,00,000 |
Total Business Value = ₹43,00,000
ROI Calculation:
(43 − 18) ÷ 18 × 100 = 139% ROI
This calculation tells leadership something meaningful.
The project created more than twice the value of its implementation cost.
Scenario 1: Customer Support Automation
Consider a growing logistics company serving more than 18,000 active customers.
The support team receives approximately 1,300 enquiries every week.
Before automation:
| KPI | Before AI |
| Support Agents | 8 |
| Average Response Time | 16 minutes |
| First Contact Resolution | 64% |
| Customer Satisfaction | 74% |
| Monthly Support Cost | ₹6.2 lakh |
Management initially expected AI to reduce staffing costs.
Instead, Product Siddha recommended automating repetitive customer enquiries while allowing agents to focus on complex cases.
After six months:
| KPI | After AI |
| Average Response Time | 90 seconds |
| First Contact Resolution | 83% |
| Customer Satisfaction | 91% |
| Repeat Customer Rate | +17% |
| Monthly Support Cost | ₹5.8 lakh |
Direct payroll savings amounted to only ₹40,000 per month.
However, customer retention improved significantly.
The company estimated that improved retention generated approximately ₹32 lakh in additional annual revenue.
If management had measured only salary savings, the project would have appeared average.
When customer retention and revenue growth were included, the automation initiative delivered an ROI of over 180 percent within the first year.
This is the difference between measuring activity and measuring business impact.
Scenario 2: Marketing Automation That Improves Revenue
Marketing teams often measure campaign performance using click-through rates and lead volumes. These numbers provide useful information, but they do not always explain which activities contribute to revenue.
A B2B technology company was generating approximately 1,500 enquiries each month from paid advertising, organic search, webinars, and email campaigns.
The marketing team struggled to identify which channels influenced buying decisions because reports relied almost entirely on last-click attribution.
Product Siddha introduced AI-powered marketing automation that connected CRM data, campaign activity, website interactions, and sales outcomes.
Before AI
| KPI | Before |
| Marketing Qualified Leads | 420 |
| Average Lead Response Time | 14 hours |
| Conversion Rate | 8.6% |
| Revenue Attributed to Marketing | Limited visibility |
After AI
| KPI | After |
| Marketing Qualified Leads | 560 |
| Average Lead Response Time | 2 hours |
| Conversion Rate | 11.9% |
| Revenue Attribution Accuracy | Significantly improved |
Within nine months, marketing-generated revenue increased by 24% because campaigns could be optimized using complete customer journey data instead of isolated interactions.
The KPIs That Matter Most
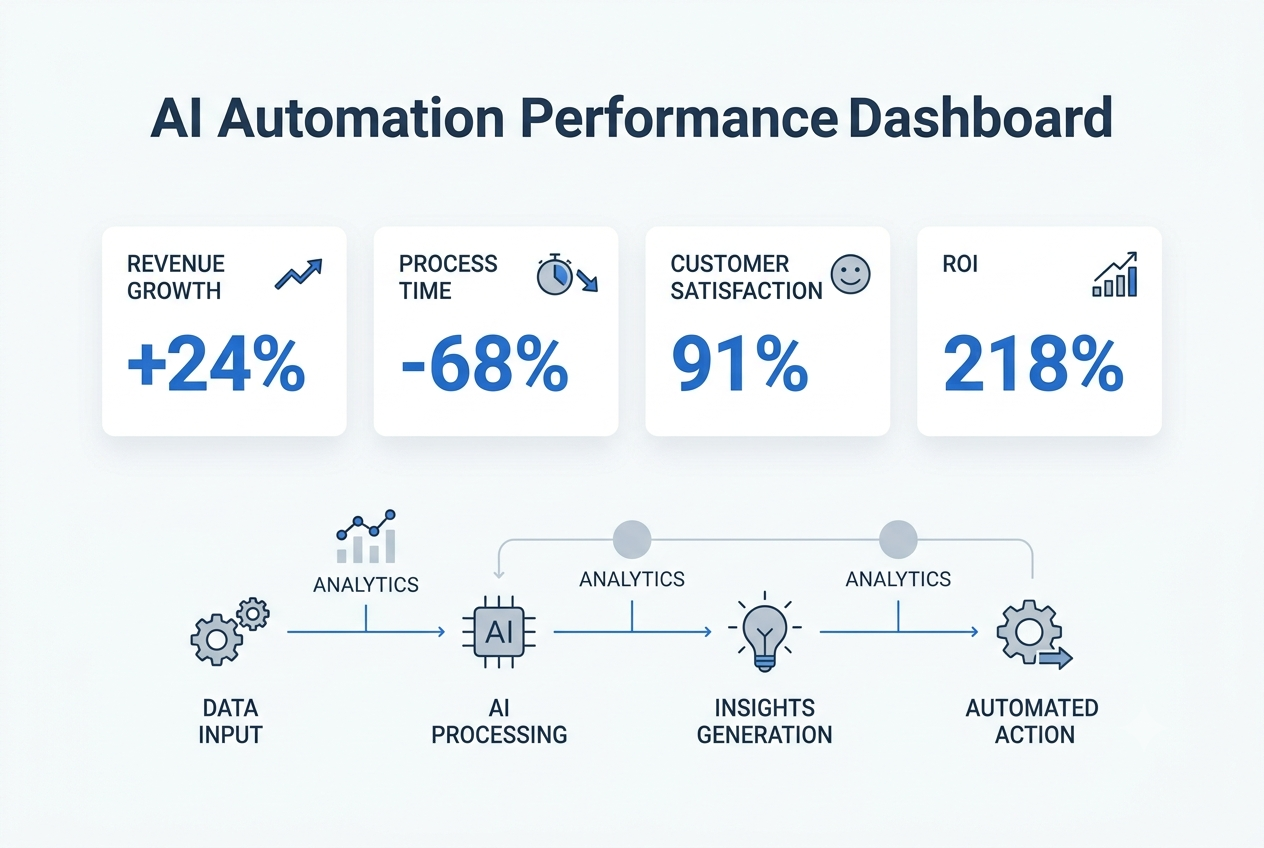
Different departments measure success differently. A useful AI automation dashboard should include financial, operational, customer, and adoption metrics.
Executive KPI Dashboard
| KPI | Target | Sample Result |
| ROI | 150% | 186% |
| Payback Period | Under 12 months | 8 months |
| Revenue Growth | 20% | 24% |
| Customer Satisfaction | 90% | 92% |
| Customer Retention | 85% | 89% |
| Process Completion Time | -50% | -68% |
| Manual Tasks Automated | 70% | 76% |
| Employee Productivity | +20% | +29% |
A dashboard like this helps executives evaluate business performance without reviewing dozens of operational reports.
Build a KPI Roadmap Before Implementation
Many organizations begin automation projects without deciding how success will be measured.
A better approach is to define milestones before implementation begins.
First 30 Days
Focus on implementation quality.
Measure:
- System uptime
- User adoption
- Workflow completion
- Integration accuracy
- Data quality
First 90 Days
Evaluate operational improvements.
Track:
- Time saved
- Process cycle time
- Employee productivity
- Customer response time
- Automation success rate
After 180 Days
Measure commercial outcomes.
Include:
- Revenue growth
- Customer retention
- Sales conversion
- Cost avoidance
- ROI
- Payback period
This staged approach provides a balanced view of automation performance over time.
KPIs That Are Often Overlooked
Many organizations monitor operational efficiency but ignore indicators that reveal long-term business value.
Examples include:
Employee Adoption Rate
If only half the workforce uses automated workflows, expected ROI will remain difficult to achieve.
Exception Rate
Monitor how often manual intervention is required.
Lower exception rates indicate that workflows are becoming more reliable.
Decision Speed
Automation often reduces the time needed for approvals, reporting, and planning.
This improvement creates business value that is difficult to measure through payroll savings alone.
Customer Lifetime Value
Improved customer experiences frequently increase repeat purchases.
This can generate significantly greater financial returns than operational savings.
How Product Siddha Measures Success
Successful AI automation projects require more than software implementation.
At Product Siddha, every engagement begins with identifying the business outcomes that matter most to leadership.
Our implementation approach includes:
- Business process assessment
- KPI framework design
- AI workflow implementation
- CRM and ERP integration
- Executive dashboard development
- Data quality improvement
- Performance reporting
- Continuous optimization
Rather than measuring automation by activity alone, we help organizations connect every workflow improvement to measurable business results.
Measure Business Value, Not Just Savings
Cost reduction is often the easiest result to measure, but it is rarely the most valuable.
AI automation creates meaningful business improvements by helping organizations respond faster, improve customer experiences, increase employee productivity, reduce operational risk, and support sustainable revenue growth.
When these outcomes are tracked using well-defined KPIs, decision-makers gain a clear understanding of how automation contributes to business performance.
Organizations that measure only payroll savings risk overlooking the improvements that have the greatest financial impact. A structured KPI framework supported by accurate reporting provides the evidence leaders need to justify future investments and continue improving business operations.
With the right strategy and implementation partner, AI Automation Services become more than a technology initiative. They become a measurable driver of long-term business growth.