
Product Siddha

product analytics

How to Connect Ads, CRM, and Analytics Into One Dashboard
Blog, Product Analytics

How to Connect Meta Ads, Google Ads, CRM, and Product Analytics Into One Unified Customer Journey Dashboard

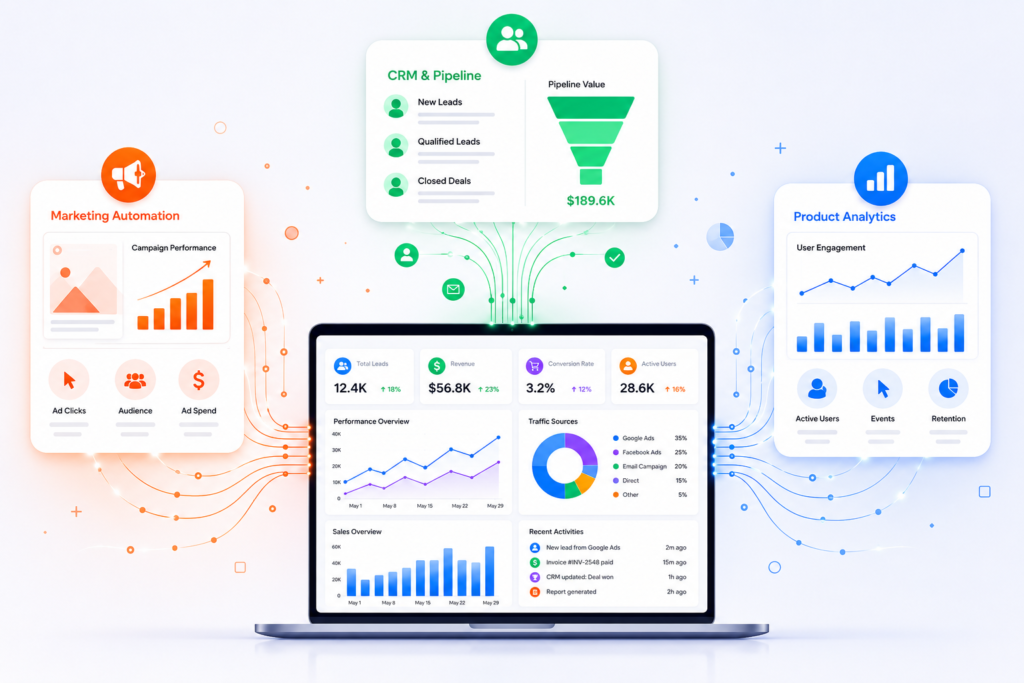
How to Connect Meta Ads, Google Ads, CRM, and Product Analytics Into One Unified Customer Journey Dashboard Most Companies Have Data. Few Have Customer Visibility. A marketing manager sees: Facebook Ads conversions Google Ads ROAS The sales team sees: HubSpot deals Salesforce opportunities The product team sees: Mixpanel funnels Amplitude retention The CEO sees three different reports telling three different stories. The core problem is not reporting. The problem is customer identity. Most businesses cannot answer: Which ad campaign generated our highest-LTV customers? Which channel creates users with the best retention? Which campaign generated revenue six months later? Which product behaviors predict future purchases? To answer those questions, businesses must connect advertising, CRM, and product analytics into a single customer journey. The Architecture of a Unified Customer Journey Dashboard A modern implementation typically looks like this: Meta Ads API ↓ Google Ads API ↓ LinkedIn Ads API HubSpot API ↓ Salesforce API Mixpanel API ↓ Amplitude API Stripe API ↓ Product Database → ETL Layer (n8n / Airbyte / Fivetran) → Data Warehouse (BigQuery / Snowflake / Redshift) → BI Layer (Looker Studio / Power BI / Tableau) The dashboard is merely the visualization layer. The real work happens in identity resolution and data integration. Step 1: Create a Universal Customer Identifier (UUID) This is the most important step. Without a shared identifier, customer journey tracking becomes impossible. When a visitor lands on your website: Generate: const customerUUID = crypto.randomUUID();   Store: First-party cookie CRM record Product analytics profile Example: Customer: UUID: 7f3b9e88-412b-44d2-bbb2-4d28f2f95f3a Every system should reference this same ID. Without UUID matching: Meta knows the click. HubSpot knows the lead. Mixpanel knows the user. Nobody knows they are the same person. Step 2: Capture Advertising Attribution Data When users arrive from advertising campaigns, capture: UTM Source UTM Medium UTM Campaign UTM Content UTM Term Example: https://yourwebsite.com ?utm_source=facebook &utm_medium=paid &utm_campaign=summer_sale Store these values alongside the UUID. Example: UUID: 7f3b9e88… Source: facebook Campaign: summer_sale Now every future event can be tied back to acquisition. Step 3: Pull Data from Meta Ads API Meta provides campaign-level performance data through the Marketing API. Typical metrics: Spend Impressions Clicks CPC CTR Purchases Leads API endpoint: GET https://graph.facebook.com/v20.0/act_{ad_account_id}/insights Schedule data pulls every hour. Store results inside: BigQuery Table: meta_ads_daily Fields: campaign_id campaign_name spend clicks impressions conversions Step 4: Pull Data from Google Ads API Google Ads provides: Search campaign performance Display campaigns Performance Max Conversion metrics Example query: SELECT campaign.name, metrics.clicks, metrics.impressions, metrics.cost_micros FROM campaign Store results in: google_ads_daily inside the warehouse. Step 5: Sync CRM Data Using HubSpot API: GET /crm/v3/objects/contacts Pull: Lead status Lifecycle stage Opportunity value Deal status Revenue Important fields: UUID Email Lead Source Revenue Close Date Now revenue can be tied back to campaigns. Step 6: Sync Product Analytics Events Mixpanel and Amplitude expose event APIs. Track: Signup Feature Used Trial Started Subscription Purchased Retention Events Example event: {  “event”:”Feature Used”,  “user_id”:”7f3b9e88…” } The UUID links analytics activity to CRM and advertising data. Step 7: Build Automated Data Pipelines Manual exports do not scale. Use: n8n Make Airbyte Fivetran Example n8n workflow: Cron Trigger ↓ Google Ads API ↓ Meta Ads API ↓ HubSpot API ↓ BigQuery ↓ Slack Alert Run: Every 60 minutes Cron expression: 0 * * * * This keeps dashboards fresh automatically. Step 8: Create Customer Journey Tables Most companies make the mistake of storing data separately. Instead create: customer_journey_master Example: UUID Source Campaign Lead Opportunity Customer Revenue 7f3b… Meta Summer Sale Yes Yes Yes $5,000 Now the entire customer lifecycle exists in one record. Step 9: Calculate Full-Funnel Metrics Once systems are connected you can answer: Marketing Metrics CAC ROAS Cost per Lead Sales Metrics Pipeline Velocity Win Rate Revenue Attribution Product Metrics Activation Rate Retention Rate Feature Adoption Unified Metrics Revenue by Campaign LTV by Channel Retention by Source CAC Payback Period This is where true business intelligence emerges. Example Customer Journey Customer clicks Meta Ad ↓ Landing Page Visit ↓ UUID Created ↓ Lead Captured in HubSpot ↓ Sales Demo Booked ↓ Customer Closed ↓ Product Signup ↓ Feature Adoption Tracked in Mixpanel ↓ Subscription Renewal ↓ Dashboard shows: Meta Campaign → Revenue → Product Retention instead of disconnected reports. Recommended Tech Stack (2026) Data Collection Google Ads API Meta Ads API HubSpot API Salesforce API Mixpanel Amplitude Integration Layer n8n Airbyte Fivetran Warehouse BigQuery Snowflake Visualization Looker Studio Tableau Power BI Final Thoughts Final Thoughts The biggest mistake businesses make is treating advertising, CRM, and product analytics as separate systems. Customers do not experience your company in silos. They move through a continuous journey: Ad Click → Lead → Opportunity → Customer → Product User → Advocate A unified dashboard should reflect that journey. The foundation is not reporting alone. It is identity resolution using UUIDs, automated API integrations, scheduled ETL pipelines, centralized data warehouses, and well-designed customer data models that connect every touchpoint across marketing, sales, and product teams. When these systems are integrated correctly, organizations can finally answer critical business questions: Which ad campaigns generate the highest-value customers? Which acquisition channels drive long-term retention? Which product behaviors predict revenue growth? Where are customers dropping off in the funnel? Which sales and marketing activities influence conversion most effectively? At Product Siddha, we help businesses design and implement these end-to-end data ecosystems. From integrating Meta Ads, Google Ads, HubSpot, Salesforce, Mixpanel, Amplitude, Stripe, and custom applications to building automated data pipelines with n8n, Make, and modern cloud data warehouses, our focus is creating a single source of truth for business growth. Whether you’re building a customer journey dashboard, implementing product analytics, establishing attribution models, or connecting fragmented systems through automation, Product Siddha helps transform disconnected data into actionable intelligence. Once the right architecture is in place, teams can move beyond reporting and start making faster, more confident decisions based on a complete view of the customer lifecycle – from first click to long-term retention and revenue growth.

How to Connect Ads, CRM, and Analytics Into One Dashboard
Blog, Product Analytics

Mixpanel vs Amplitude: Which Product Analytics Tool Is Better in 2026?

Mixpanel vs Amplitude: Which Product Analytics Tool Is Better in 2026? Beyond Dashboards Choosing a Product Analytics Tool has become more complicated than selecting a dashboard with attractive charts. In 2026, product teams are expected to understand customer journeys, predict churn, improve onboarding experiences, and identify the features that truly drive retention. The analytics platform behind these decisions has a direct impact on how quickly teams discover problems and respond to them. Two names continue to dominate this conversation – Mixpanel and Amplitude. At first glance, both platforms appear remarkably similar. They track events, build funnels, analyze user behavior, and measure retention. Yet after working with businesses at different growth stages, we have observed that the real differences emerge when products become more complex and teams rely on analytics every day. At Product Siddha, we believe the question is not simply which Product Analytics Tool is better. The better question is which platform aligns with the maturity of your product, your team’s analytical capabilities, and your long-term goals. Product Analytics in 2026 Is Changing Rapidly Five years ago, businesses mainly used analytics to measure traffic and conversions. Today, product teams want to know: Why customers abandon onboarding. Which features increase retention. What actions predict churn. How customer journeys differ across segments. Which experiments improve engagement. How AI can surface hidden patterns automatically. This shift has transformed the role of a Product Analytics Tool from a reporting platform into a decision-making system. That is why choosing between Mixpanel and Amplitude deserves careful consideration. Mixpanel Prioritizes Speed and Simplicity Mixpanel has always focused on making product analytics approachable. Its event-based tracking system is straightforward. Product managers can create funnels, monitor retention, and build reports without extensive technical expertise. This simplicity is one of its greatest strengths. At Product Siddha, we have seen startups implement Mixpanel within days and begin making data-informed decisions almost immediately. The platform works exceptionally well for: SaaS startups Mobile applications Subscription businesses Early-stage products Teams without dedicated data analysts Its interface is intuitive. Reports are easy to understand. Teams spend less time learning the platform and more time acting on insights. However, simplicity sometimes comes with trade-offs. As products evolve and customer journeys become more sophisticated, businesses may begin seeking deeper behavioral analysis. Amplitude Focuses on Behavioral Intelligence Amplitude approaches analytics differently. The platform was designed to answer questions about customer behavior over time. Rather than concentrating only on events, Amplitude emphasizes: Behavioral cohorts User journeys Feature adoption Long-term retention Predictive insights Product experimentation For organizations operating complex products, these capabilities can become extremely valuable. Amplitude excels when businesses need to understand: Why do customers remain loyal? Which behaviors lead to long-term retention? Which product experiences influence growth? This depth has made Amplitude a preferred Product Analytics Tool for many enterprise and product-led organizations. The Biggest Difference Is Philosophy After implementing both platforms across various business environments, one difference consistently stands out. Mixpanel asks: “What happened?” Examples: How many users converted? Which funnel step lost customers? Which campaign generated signups? Amplitude asks: “Why did it happen?” Examples: Why are customers leaving? Which behaviors increase retention? Which user paths create long-term value? This distinction influences the type of insights teams receive and how they make decisions. Mixpanel vs Amplitude Comparison Table Category Mixpanel Amplitude Best For Startups and SaaS Mid-size and Enterprise Ease of Use Excellent Moderate Funnel Analysis Excellent Excellent User Journey Analysis Good Advanced Cohort Analysis Strong Exceptional Product Experimentation Basic Advanced Behavioral Analytics Good Excellent Learning Curve Low Moderate Team Adoption Fast Requires Training Long-Term Scalability Good Excellent Why Many Startups Begin with Mixpanel One trend has become increasingly common. Many startups adopt Mixpanel during the early stages of growth. The reasons are practical. Mixpanel offers: Faster implementation Lower complexity Clear reporting Easier onboarding Faster team adoption When product teams are small, these advantages matter. Business leaders often prefer receiving clear answers quickly instead of navigating a highly sophisticated analytics environment. Why Growing Companies Eventually Evaluate Amplitude As businesses expand, analytics requirements often change. More features are introduced. Customer journeys become longer. Products support multiple user segments. Teams begin asking more advanced questions. This is where Amplitude becomes attractive. Its strengths include: Feature adoption analysis Behavioral cohorts Customer lifecycle tracking Experimentation frameworks Predictive analytics Journey mapping These capabilities provide a richer understanding of customer behavior. But More Features Are Not Always Better This is an important point that many comparison articles overlook. The most advanced Product Analytics Tool does not automatically produce better outcomes. In fact, businesses often fail with analytics because: Events are poorly defined. Teams track too many metrics. Naming conventions are inconsistent. Dashboards become cluttered. Product teams collect data but rarely act on it. We have seen companies invest heavily in sophisticated analytics platforms while continuing to make decisions based on intuition. Analytics succeeds when teams create a culture of curiosity and continuous improvement. AI Is Reshaping Product Analytics The rise of artificial intelligence is changing how businesses use analytics. In 2026, teams increasingly expect their Product Analytics Tool to provide: AI-generated insights Churn predictions Automated anomaly detection Session summaries Behavioral recommendations Smart segmentation Mixpanel has introduced AI-powered analysis to simplify insight discovery. Amplitude continues investing heavily in behavioral intelligence and predictive analytics. The competition is no longer about building charts. It is about helping teams discover meaningful actions faster. If I Had to Choose in 2026 This is the recommendation we often provide at Product Siddha. Choose Mixpanel if: Your company is in an early growth stage. Product teams need answers quickly. Simplicity is important. Resources are limited. You want rapid implementation. Choose Amplitude if: You operate a product-led business. Customer journeys are complex. Product experimentation is important. Behavioral analytics drives decisions. Long-term customer retention is a priority. Neither choice is universally correct. The best Product Analytics Tool depends on your business stage and analytical maturity. Looking Ahead The debate between Mixpanel and Amplitude will continue as both platforms evolve. Mixpanel remains one of the easiest analytics platforms to adopt and

Product Siddha
Privacy Overview

This website uses cookies so that we can provide you with the best user experience possible. Cookie information is stored in your browser and performs functions such as recognising you when you return to our website and helping our team to understand which sections of the website you find most interesting and useful.