How to Build an AI Customer Support Agent for Under ₹25,000
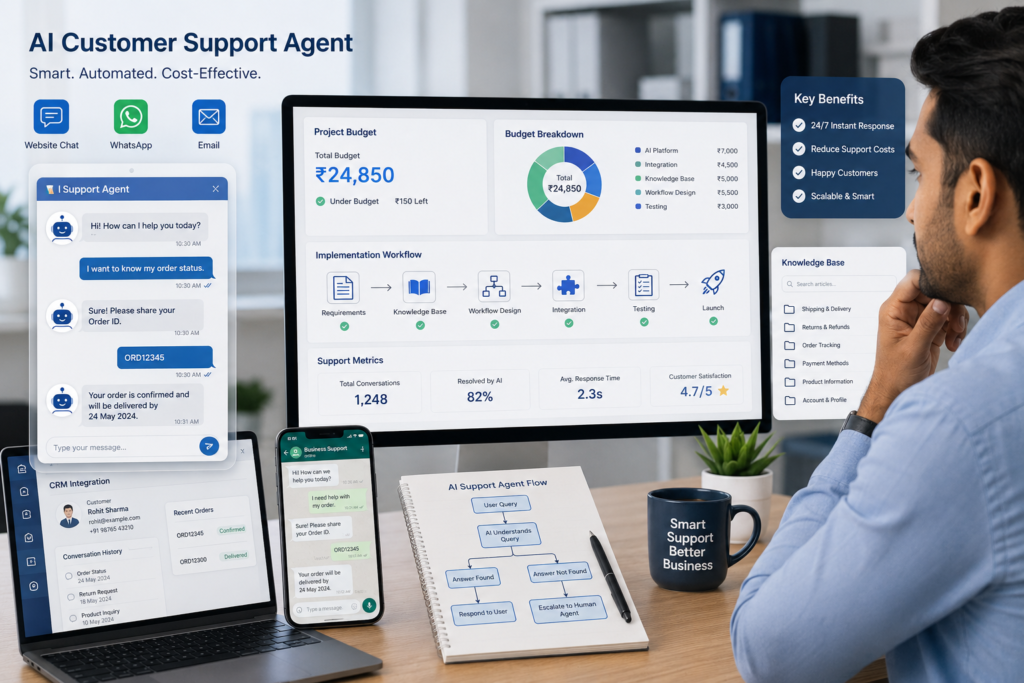
How to Build an AI Customer Support Agent for Under ₹25,000 Start with a Practical Plan Artificial intelligence has become more accessible for businesses of every size. Small companies that once considered automated customer support too expensive can now build capable AI support agents with a modest budget. The challenge is no longer whether automation is affordable. The challenge is knowing where to spend money and how to avoid unnecessary complexity. A well-planned AI customer support agent can answer common questions, guide customers through basic processes, collect information, and transfer conversations to human staff when needed. When designed carefully, these systems improve response times while reducing repetitive work for support teams. At Product Siddha, we help businesses build AI automation solutions that match their operational needs and available budget. The goal is to create systems that solve real customer problems instead of adding another layer of technology to manage. Define What Your AI Agent Should Handle Many projects fail because businesses expect an AI agent to answer every possible question from the first day. Instead, begin with repetitive customer enquiries. Typical examples include: Order status enquiries Business hours Pricing information Appointment booking Product availability Shipping questions Frequently asked questions Basic troubleshooting Limiting the initial scope improves accuracy and reduces implementation costs. Build a Reliable Knowledge Base An AI support agent depends on the quality of the information it receives. Before selecting any platform, collect your business knowledge in one place. Include: Frequently asked questions Product documentation Service descriptions Return policies Delivery information Contact details Internal support procedures Clear and well-organized content produces better customer responses. Plan Your Budget Carefully A budget of ₹25,000 is sufficient for a simple implementation when spending is controlled. Expense Estimated Cost AI platform subscription ₹5,000 to ₹8,000 Website integration ₹3,000 to ₹5,000 Knowledge base preparation ₹4,000 to ₹6,000 Workflow setup ₹5,000 to ₹7,000 Testing and improvements ₹2,000 to ₹4,000 The exact cost depends on the complexity of your support requirements and the number of systems involved. Choose the Right Communication Channels Customers expect support through multiple channels. Your AI agent may operate through: Website live chat WhatsApp Business Email Customer portal Mobile application Start with one or two channels before expanding further. This approach simplifies testing and maintenance. Design Clear Conversation Flows An effective support agent follows structured conversations. For example: Customer Question ↓ AI identifies the request ↓ Provides relevant answer ↓ Requests additional information if required ↓ Resolves the issue ↓ Transfers to human support when necessary Well-designed conversation paths reduce customer frustration and improve resolution rates. Connect Business Systems An AI agent becomes far more useful when it connects with existing business systems. Useful integrations include: CRM Order management system Inventory software Help desk platform Appointment scheduler Payment records These integrations allow customers to receive accurate information without requiring manual intervention. Test Before Going Live Testing often determines whether customers trust the system. Review situations such as: Incorrect customer questions Spelling mistakes Multiple language variations Missing information Escalation requests Complex enquiries Each test improves the overall customer experience. Important Performance Metrics Once deployed, monitor performance regularly. Useful KPIs include: KPI Why It Matters Response Time Customer experience Resolution Rate Support effectiveness Escalation Rate AI limitations Customer Satisfaction Service quality Repeat Questions Knowledge gaps Average Handling Time Operational efficiency Monitoring these measurements helps improve the system over time. Common Mistakes to Avoid Businesses often encounter similar challenges during implementation. These include: Poor documentation Weak knowledge bases Overly complex workflows Missing integrations Lack of testing No escalation process Unrealistic customer expectations Avoiding these issues saves both time and money. When DIY Reaches Its Limits Building a simple AI customer support agent is achievable with careful planning and a modest budget. However, many businesses discover that scaling the solution introduces new challenges. As customer enquiries become more varied, businesses often need: CRM integration Workflow automation Reporting dashboards Data synchronization Security controls Multi-channel support Performance optimization These requirements usually extend beyond a basic implementation. This is where experienced implementation partners provide long-term value. How Product Siddha Helps At Product Siddha, we help businesses move from basic automation to reliable customer support systems that grow with the business. Our services include: AI automation consulting Customer support workflow design Knowledge base development CRM integration Business process automation Performance dashboards AI implementation Ongoing optimization Whether you are building your first AI support agent or improving an existing solution, our team helps ensure the system delivers measurable business value. Build Smart, Then Grow An AI customer support agent does not require a large technology budget to deliver meaningful results. With a clear scope, reliable business information, careful budgeting, and structured testing, many businesses can build an effective solution for under ₹25,000. The most successful projects begin with realistic expectations and continue to improve through regular measurement and refinement. As support requirements grow, businesses can expand their AI capabilities through deeper integrations and more advanced automation. For organizations seeking a dependable implementation partner, Product Siddha helps transform practical ideas into customer support solutions that improve service quality while supporting long-term business growth.