Product Siddha

MVP Developement

AI Automation, Blog

AI Automation Governance in 2026: Frameworks to Scale Without Breaking Systems

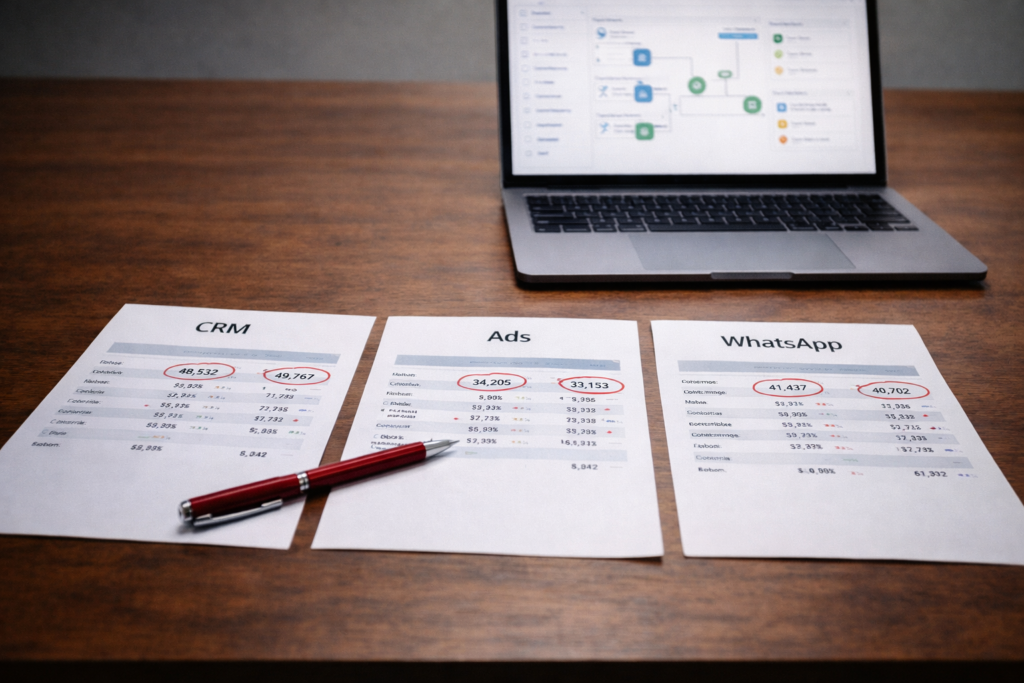
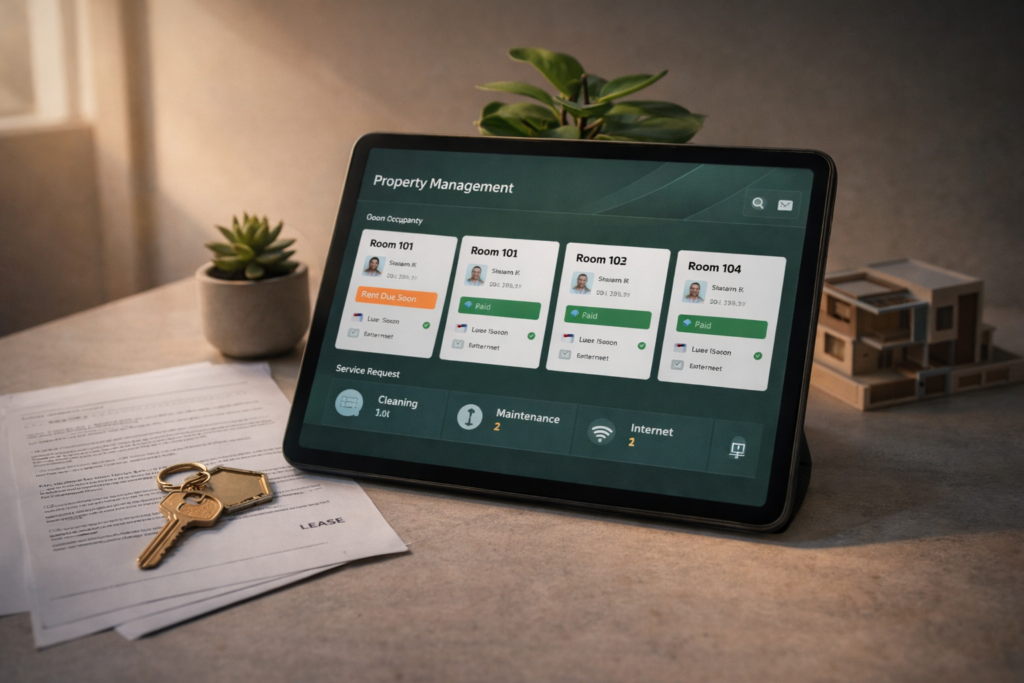
AI Automation Governance in 2026: Frameworks to Scale Without Breaking Systems A Quiet Risk in Fast Automation Automation is no longer a side project. It now sits inside daily operations across sales, marketing, finance, and support. Many firms adopted automation quickly over the past three years. They connected tools, deployed AI agents, and replaced manual work at speed. Growth followed, but so did a new class of problems. Workflows break without warning. Data flows lose accuracy. Teams lose visibility into what is running and why. In some cases, no one knows who owns a system that touches revenue. This is where governance enters the picture. For any serious Product Siddha, governance is not a control layer that slows work. It is the structure that allows systems to grow without failure. What Governance Means in AI Automation Governance in this context is not about rules alone. It is about clarity. Every automated system should answer three basic questions: Who owns this workflow What data does it depend on How is success measured When these answers are missing, teams operate in fragments. Automation then creates more confusion instead of efficiency. An experienced AI automation agency builds governance into the system from the start. This includes naming standards, version control, access rules, and monitoring. Without these, scaling becomes risky. Where Systems Usually Break Most breakdowns follow familiar patterns. They do not come from complex algorithms. They come from simple gaps. 1. No Ownership A workflow runs across marketing and sales, but neither team owns it fully. When it fails, each assumes the other is responsible. 2. Fragmented Data Sources CRM, analytics, and communication tools operate on different data sets. A small mismatch creates large reporting errors. 3. Silent Failures An automation stops working but sends no alert. The issue is discovered days later when leads or revenue drop. 4. Uncontrolled Scaling A workflow built for 100 users is extended to 10,000 without testing. Performance issues follow. Core Governance Framework for 2026 A structured approach helps avoid these failures. The following framework reflects how modern teams are organizing automation at scale. Governance Layer Overview Layer Purpose Key Actions Ownership Define responsibility Assign clear owners for each workflow Data Integrity Ensure accuracy Standardize data sources and validation Monitoring Track performance Set alerts and logs for every process Version Control Manage changes Maintain workflow history and rollback options Compliance Protect data Apply access rules and audit logs Ownership First, Technology Second Governance begins with ownership. Before building a workflow, define who is responsible for its performance. In one implementation involving HubSpot and WhatsApp automation, a fintech team faced repeated failures in lead routing. The issue was not technical. Ownership was unclear. Once responsibility shifted to a single operations lead, failure rates dropped within weeks. This principle applies across industries. Without ownership, even the best automation tools fail. Data Integrity as the Foundation Automation depends on clean and consistent data. A small mismatch can affect multiple systems. A strong example comes from the case study “Product Analytics & Full-Funnel Attribution for a SaaS Coaching Platform.” The team struggled with inconsistent attribution across channels. Leads appeared in dashboards but did not match CRM records. The solution was not a new tool. It was a unified data model. Events were standardized, naming conventions were fixed, and tracking points were aligned across platforms. Once this was done, reporting accuracy improved significantly. Monitoring That Actually Works Many teams rely on basic logs. These are often ignored. Effective monitoring requires active alerts. Set thresholds for key metrics Trigger alerts when workflows fail Track execution time and error rates In the case “From Lead to Site Visit – Voice AI Automation for a Real Estate Platform,” monitoring played a critical role. Voice AI handled incoming calls and scheduled visits. When response delays crossed a defined limit, alerts were triggered. This allowed the team to act before user experience declined. Controlled Scaling Instead of Rapid Expansion Scaling automation should follow a controlled path. Start small, test thoroughly, then expand. This staged approach prevented overload and ensured each layer worked as expected. Role of an AI Automation Agency Governance is difficult to implement internally without experience. Many teams focus on tools rather than structure. This is where an AI automation agency provides value. An agency does not just build workflows. It defines how systems behave over time. This includes: Designing scalable architecture Establishing governance standards Integrating tools into a unified system Creating monitoring and reporting layers Product Siddha has followed this approach across multiple engagements. In the case “Built Custom Dashboards by Stage,” dashboards were not just visual tools. They became governance instruments. Each stage of the funnel had defined metrics, ownership, and alerts. Automation Governance Lifecycle Design → Ownership Assignment → Data Standardization → Deployment → Monitoring → Optimization This cycle repeats as systems evolve. Governance is not a one-time setup. It is a continuous process. Common Mistakes to Avoid Even experienced teams fall into predictable traps. Treating governance as documentation only Ignoring monitoring until failures occur Allowing multiple teams to edit workflows without control Scaling workflows before testing edge cases Each of these leads to instability over time. A Practical Checklist Before scaling any automation system, review the following: Question Status Is ownership clearly defined Yes or No Are data sources unified Yes or No Are alerts configured Yes or No Is there a rollback option Yes or No Has the workflow been tested at scale Yes or No If any answer is no, the system is not ready to scale. The Path Forward AI automation will continue to expand across industries. The difference between success and failure will not depend on tools alone. It will depend on structure. Governance provides that structure. It ensures that systems remain reliable as they grow. It reduces risk without slowing progress. Most importantly, it allows teams to trust their automation. For companies working with an AI automation agency like Product Siddha, governance is not an added feature. It is part of the foundation.

Blog, Product Analytics

CRM, Ads, and WhatsApp Not Syncing? Here’s How to Fix Your Data Flow

CRM, Ads, and WhatsApp Not Syncing? Here’s How to Fix Your Data Flow When Systems Fall Out of Step A common problem in growing businesses is simple to describe and difficult to fix. Leads come in from ads, conversations happen on WhatsApp, and customer data sits in a CRM. Each system works on its own, yet they fail to stay in sync. The result is confusion. Sales teams follow up late. Marketing teams cannot track performance accurately. Reports do not match across platforms. This is not a tool problem. It is a data flow problem. Product Siddha approaches such issues by treating the entire system as one connected flow. Fixing the sync requires careful tracing, not quick adjustments. What “Not Syncing” Really Means When systems do not sync, the issue usually appears in one of the following ways: Leads captured in ads do not appear in the CRM WhatsApp conversations are not linked to customer records Campaign data does not reflect actual conversions Duplicate or missing entries across platforms These symptoms point to gaps in how data moves between systems. Step 1 – Map the Full Data Journey Begin by tracing how data should move. A typical flow looks like this: User clicks on an ad Lead data is captured Data is sent to CRM Sales team engages via WhatsApp Updates are recorded back in the system Write down each step. Identify where the flow breaks. In From Lead to Site Visit – Voice AI Automation for a Real Estate Platform, mapping the journey revealed delays between lead capture and follow-up. Fixing that gap improved conversions. Clarity at this stage is essential. Step 2 – Check Data Entry Points Data flow begins at the source. Review how leads are captured from ads. Ensure that forms, tracking links, and APIs are working correctly. Small errors at this stage can block the entire system. For example: Incorrect field mapping Missing parameters Broken form submissions Fixing entry points often resolves major syncing issues. Step 3 – Verify CRM Integration The CRM acts as the central system. Check whether incoming data is reaching the CRM in real time. Confirm that fields are mapped correctly and records are created without duplication. In HubSpot Marketing Hub Setup for a Growing Fintech Brand, aligning data fields across systems ensured that marketing and sales worked with the same information. A well-configured CRM is critical for stable data flow. Step 4 – Inspect WhatsApp Connectivity WhatsApp integration adds another layer. Ensure that conversations are linked to the correct customer records. Verify that messages trigger updates in the CRM. Common issues include: Unlinked phone numbers Delayed message syncing Missing conversation logs In AI Automation Services for French Rental Agency MSC-IMMO, improving communication flow required connecting messaging systems directly with operational data. This reduced delays and improved response quality. Messaging systems must be treated as part of the data ecosystem. Step 5 – Standardize Data Formats Different systems store data in different formats. Standardize fields such as: Phone numbers Email addresses Campaign identifiers Inconsistent formats lead to mismatches and duplicate records. A simple rule such as using one format for phone numbers can prevent multiple issues. Step 6 – Review API and Integration Health Most syncing depends on APIs. Check whether APIs are active, authenticated, and functioning as expected. Monitor for errors or rate limits that may interrupt data flow. API failures often go unnoticed until problems accumulate. Step 7 – Eliminate Duplicate Data Paths Over time, multiple integrations may be added. This can create duplicate data flows, where the same lead enters the system through different paths. Review all integrations and remove redundant connections. A single, clear path improves reliability. Step 8 – Test the Entire Flow Once fixes are applied, test the system end-to-end. Create sample leads, track them through each stage, and verify outputs. Testing should confirm: Data appears in the CRM WhatsApp conversations are linked Campaign data is recorded correctly This step ensures that all parts work together. Step 9 – Set Up Monitoring and Alerts After fixing the system, ongoing monitoring is necessary. Set alerts for: Failed data transfers Missing records Delayed updates Early detection prevents larger issues. Broken vs Synced Data Flow Aspect Broken Data Flow Synced Data Flow Lead Tracking Incomplete Accurate Communication Disconnected Linked to records Reporting Inconsistent Reliable Team Efficiency Reduced Improved Decision Making Delayed Timely A Grounded View Data flow issues rarely come from one major failure. They build from small gaps across systems. Fixing them requires patience and a clear process. Each step must be verified, and each connection must be reliable. Product Siddha focuses on building systems where data moves smoothly across platforms. The aim is to create consistency that teams can rely on. Final Reflection When CRM, ads, and WhatsApp stop syncing, the impact spreads across the business. Leads are lost, teams lose confidence in data, and decisions slow down. A structured approach restores order. By mapping the flow, fixing inputs, and strengthening integrations, businesses can rebuild a system that works as expected. Reliable data flow is not a luxury. It is a foundation for growth.

AI Automation, Blog

Fixing Broken Automations: A Troubleshooting Guide for Scaling Teams

Fixing Broken Automations: A Troubleshooting Guide for Scaling Teams When Automation Stops Working Automation is often introduced to reduce manual effort and improve consistency. In the early stages, it works well. Tasks are completed faster, teams rely less on repetitive work, and systems appear stable. As the business grows, cracks begin to show. Workflows fail without warning. Data stops syncing. Notifications are delayed or sent incorrectly. These issues rarely come from one major failure. They build up over time. Scaling teams depend heavily on reliable automation services. When those systems break, the impact spreads quickly across operations. Fixing them requires a structured approach rather than quick fixes. Product Siddha treats broken automation as a system issue, not an isolated error. Common Signs of Broken Automations Before troubleshooting, it helps to identify clear symptoms. Leads are not routed correctly Emails or notifications are delayed Data mismatches between systems Reports showing incomplete information Manual intervention increasing over time These signs indicate that the automation system is no longer aligned with current workflows. Step 1 – Trace the Workflow End-to-End Start by mapping the full automation flow. Identify each step, from trigger to final output. Note where data enters, how it moves, and where actions are executed. Many teams discover that their workflows have grown more complex than expected. Small additions over time create fragile chains. In AI Automation Services for French Rental Agency MSC-IMMO, the issue was not a single failure point. It was a combination of delayed triggers and inconsistent data updates. Mapping the workflow revealed hidden dependencies that needed correction. Clarity at this stage prevents guesswork. Step 2 – Check Data Inputs First Automation depends on clean and consistent data. Review the inputs that trigger workflows. Look for missing fields, incorrect formats, or outdated values. If the input is flawed, the output will be unreliable. In Product Analytics for a Ride-Hailing App with Mixpanel, data inconsistencies affected event tracking. Cleaning input data restored accuracy and improved system performance. This step often resolves more issues than expected. Step 3 – Validate Triggers and Conditions Triggers define when automation starts. Conditions define how it proceeds. Check whether triggers are firing correctly. Confirm that conditions still match current business rules. As processes evolve, conditions may become outdated. This leads to workflows that either do not run or run incorrectly. Accurate triggers are essential for dependable automation services. Step 4 – Review Integrations Between Systems Most automation systems rely on multiple tools working together. Inspect integrations carefully. Check whether APIs are functioning, credentials are valid, and data is syncing as expected. In HubSpot Marketing Hub Setup for a Growing Fintech Brand, integration issues initially caused delays in data flow. Resolving these connections restored system reliability. Integration failures are a common source of broken automation. Step 5 – Audit Workflow Logic Over time, workflows become layered with additional rules. Review the logic step by step. Remove unnecessary conditions and simplify where possible. Complex workflows are harder to maintain and more prone to failure. A clear structure improves both performance and reliability. Step 6 – Monitor Execution Logs Logs provide insight into what actually happens during execution. Check logs for errors, delays, or skipped steps. These details help identify where the system is failing. Teams often overlook logs, but they offer direct evidence of issues. Step 7 – Test in Controlled Conditions Before applying fixes, test workflows in a controlled environment. Use sample data to verify changes. Confirm that each step works as expected. Testing reduces the risk of introducing new errors while fixing existing ones. Step 8 – Rebuild Where Necessary Some workflows cannot be fixed through small adjustments. If a system has become too complex, rebuilding it may be more efficient. A fresh structure removes hidden issues and improves clarity. In Built Custom Dashboards by Stage, restructuring data flows simplified reporting and reduced errors. The same principle applies to automation systems. Rebuilding is sometimes the most practical solution. Step 9 – Establish Monitoring and Alerts Once automation is fixed, ongoing monitoring is essential. Set up alerts for failures or delays. Regular checks ensure that issues are detected early. Reliable automation services depend on continuous oversight. Step 10 – Align Automation with Current Processes Automation should reflect how the business operates today. Review workflows regularly to ensure alignment. Update triggers, conditions, and integrations as processes evolve. In From Lead to Site Visit – Voice AI Automation for a Real Estate Platform, aligning automation with actual user behavior improved response time and conversion outcomes. Alignment keeps systems relevant. Broken vs Optimized Automation Aspect Broken Automation Optimized Automation Reliability Inconsistent Stable Data Accuracy Unreliable Accurate Maintenance Frequent fixes Minimal intervention Team Effort High manual work Reduced workload Scalability Limited Supports growth A Practical Perspective Automation systems are often built quickly to solve immediate needs. As the business grows, these systems must evolve. Ignoring small issues leads to larger failures. Addressing them early keeps operations smooth. Product Siddha focuses on building automation systems that remain reliable over time. The emphasis is on clarity, simplicity, and adaptability. Final Insight Fixing broken automation is not about patching errors. It is about understanding the system as a whole. A structured approach helps identify root causes, restore reliability, and prepare systems for future growth. With careful troubleshooting and ongoing monitoring, automation can continue to support scaling teams effectively.

Blog, MarTech Implementation

How to Migrate from Legacy Systems to a Modern MarTech Stack

How to Migrate from Legacy Systems to a Modern MarTech Stack The Turning Point Many organizations continue to rely on legacy systems long after they have outlived their usefulness. Reports take time to prepare, data remains scattered, and integrations feel fragile. Teams work around limitations instead of solving them. A modern MarTech stack brings structure, speed, and clarity. It connects tools, aligns data, and supports better decision making. The challenge lies in moving from the old system to the new one without disrupting ongoing operations. Product Siddha approaches this transition as a phased process. Careful planning reduces risk and ensures that the new system delivers real value. Step 1 – Assess Your Current Systems Begin with a clear understanding of what you have today. List all tools and platforms used for marketing, sales, and analytics. Identify how they connect, what data they store, and where gaps exist. Common issues include: Duplicate data across systems Manual data transfers Limited reporting capabilities Poor integration between tools This assessment forms the base for your migration plan. Step 2 – Define Business Requirements Do not start with tools. Start with needs. Clarify what your organization expects from a modern MarTech stack. This may include: Centralized customer data Real-time reporting Automated workflows Better campaign tracking In Product Management for UAE’s First Lifestyle Services Marketplace, aligning tools with business needs helped streamline operations and improve service delivery. Clear requirements prevent unnecessary complexity later. Step 3 – Design the Target Architecture A modern MarTech stack is more than a collection of tools. It is a connected system. Define how data will flow between platforms. Identify key components such as: Customer data platform or CRM Marketing automation tools Analytics and reporting systems Data storage solutions This design ensures that each tool has a defined role. Step 4 – Clean and Prepare Data Data quality often determines the success of migration. Before moving data, review and clean it. Remove duplicates, fix inconsistencies, and standardize formats. In Product Analytics for a Ride-Hailing App with Mixpanel, data preparation played a key role in ensuring accurate tracking and reporting. Without this step, insights would have been unreliable. Clean data reduces errors in the new system. Step 5 – Choose the Right Tools Tool selection should follow system design, not the other way around. Evaluate tools based on: Compatibility with existing systems Ease of integration Scalability Reporting capabilities In Boosting Email Revenue with Klaviyo for a Shopify Brand, selecting the right platform allowed better segmentation and improved campaign performance. The goal is to build a stack that works as a unified system. Step 6 – Plan the Migration in Phases Avoid a complete switch in one step. Break the migration into smaller phases. Move one function at a time, such as email marketing or analytics. This approach reduces disruption and allows teams to adapt gradually. Step 7 – Integrate Systems Carefully Integration is where many migrations face challenges. Ensure that data flows correctly between tools. Test each connection and verify outputs. In HubSpot Marketing Hub Setup for a Growing Fintech Brand, careful integration ensured that marketing and sales data remained aligned. This improved visibility and coordination. Strong integration supports reliable reporting. Step 8 – Test Before Full Deployment Testing should be thorough and structured. Validate data accuracy, workflow performance, and reporting outputs. Compare results with legacy systems to ensure consistency. Testing reduces the risk of errors after launch. Step 9 – Train Teams and Adjust Workflows A new MarTech stack changes how teams work. Provide training on tools and processes. Adjust workflows to match the new system. In Built Custom Dashboards by Stage, adoption improved when teams understood how to use data effectively in their daily work. Training ensures that the system delivers value. Step 10 – Decommission Legacy Systems Once the new system is stable, phase out legacy tools. Ensure that all critical data has been migrated and verified. Gradual decommissioning prevents data loss and confusion. Legacy Systems vs Modern MarTech Stack Aspect Legacy Systems Modern MarTech Stack Data Access Fragmented Centralized Reporting Delayed Real-time Integration Limited Seamless Scalability Restricted Flexible Efficiency Manual processes Automated workflows A Measured Perspective Migration is not only a technical task. It is an operational shift. It requires coordination between teams, careful planning, and ongoing evaluation. Rushing the process often leads to errors and delays. Product Siddha focuses on building systems that remain effective over time. The emphasis is on clarity, reliability, and long-term usability. Final Thought Moving from legacy systems to a modern MarTech stack is a significant step. It brings better data, faster decisions, and improved coordination across teams. The process may seem complex, but a structured approach makes it manageable. With careful planning and execution, organizations can build a system that supports growth and adapts to future needs.

Blog, Product Analytics

How to Replace Manual Reporting with Real-Time Dashboards (Step-by-Step)

How to Replace Manual Reporting with Real-Time Dashboards (Step-by-Step) The Reporting Shift Manual reporting often begins as a simple process. A few spreadsheets, weekly updates, and shared documents seem manageable in the early stages. Over time, the effort grows. Data comes from multiple sources, reports take longer to prepare, and numbers do not always match. Real-time dashboards solve this problem by creating a single, reliable view of data. They reduce manual effort and allow teams to act on current information instead of outdated summaries. At Product Siddha, this shift is approached as a structured transition rather than a quick replacement. The goal is not just to build dashboards, but to build trust in data. Step 1 – Map Your Current Reporting Process Start by understanding how reporting works today. List all reports created by your team. Identify where the data comes from, who prepares it, and how often it is updated. This step often reveals hidden inefficiencies. For example, one team may pull marketing data weekly while another updates sales numbers daily. These differences create inconsistency. Documenting the current state helps define what needs to change. Step 2 – Identify Key Metrics Not every number needs to be on a dashboard. Focus on metrics that influence decisions. These may include conversion rates, revenue, user activity, or campaign performance. In Product Analytics & Full-Funnel Attribution for a SaaS Coaching Platform, clarity came from narrowing down metrics to those that directly affected growth. This reduced noise and improved decision making. A clear set of metrics keeps dashboards useful and easy to understand. Step 3 – Consolidate Data Sources Manual reporting often relies on multiple platforms. Bring these sources together into a unified system. This may include: CRM data Advertising platforms Website analytics Internal databases The goal is to create a single flow of data. Without this step, dashboards will reflect the same inconsistencies as manual reports. Step 4 – Build a Data Pipeline A data pipeline collects, processes, and prepares data for visualization. This step involves: Extracting data from sources Cleaning and standardizing it Storing it in a central location In Built Custom Dashboards by Stage, structured pipelines ensured that each stage of the funnel had accurate and consistent data. This made dashboards reliable across teams. A well-designed pipeline is the foundation of real-time reporting. Step 5 – Choose the Right Dashboard Structure Dashboards should match how teams work. Instead of creating one large dashboard, consider separate views for different functions. Marketing, sales, and leadership may need different perspectives. Each dashboard should answer a specific question. For example: How are campaigns performing Where are users dropping off Which channels drive revenue Clear structure improves usability. Step 6 – Automate Data Updates Real-time dashboards depend on automated updates. Set up schedules or real-time data flows so that information stays current. This removes the need for manual refreshes. In Driving Growth for a U.S. Music App with Full-Stack Mixpanel Analytics, automated tracking allowed teams to monitor user behavior continuously. This enabled faster adjustments and better engagement. Automation is what separates dashboards from static reports. Step 7 – Validate Data Accuracy Before relying on dashboards, verify the data. Compare dashboard numbers with existing reports. Check for differences and resolve them. This step builds confidence among stakeholders. Even small discrepancies can reduce trust. Careful validation prevents this issue. Step 8 – Train Teams to Use Dashboards A dashboard is only useful if teams understand it. Provide simple guidance on how to read metrics and interpret trends. Encourage teams to use dashboards in regular discussions. In HubSpot Marketing Hub Setup for a Growing Fintech Brand, adoption improved when teams aligned their workflows with dashboard insights. This ensured that data was actively used. Training turns dashboards into decision tools. Step 9 – Replace Manual Reports Gradually Do not remove manual reporting all at once. Run dashboards alongside existing reports for a short period. This allows teams to adjust and verify accuracy. Once confidence is established, phase out manual reports. This reduces resistance and ensures a smooth transition. Step 10 – Review and Improve Dashboards should evolve with the business. Review them regularly. Remove unused metrics and add new ones as needed. Continuous improvement keeps dashboards relevant. Manual Reporting vs Real-Time Dashboards Aspect Manual Reporting Real-Time Dashboards Update Frequency Periodic Continuous Effort Required High Low Data Accuracy Prone to errors Consistent Decision Speed Slow Immediate Scalability Limited High A Grounded View Replacing manual reporting is not only a technical upgrade. It is a shift in how teams interact with data. The process requires planning, validation, and training. When done carefully, it reduces effort and improves clarity. Product Siddha focuses on building systems that support long-term use. The aim is to ensure that dashboards remain reliable as the business grows. Final Note Real-time dashboards bring structure to data and speed to decision making. They remove repetitive work and provide a consistent view of performance. The transition may take time, but the benefits are lasting. With a clear step-by-step approach, organizations can move from manual reporting to a more efficient and reliable system.

Blog, MarTech Implementation

What Does It Cost to Build a Custom Data Pipeline for Marketing?

What Does It Cost to Build a Custom Data Pipeline for Marketing? Understanding the Cost Question When businesses ask about the cost of building a custom data pipeline for marketing, the question rarely stands alone. It usually comes from a place of friction. Reports do not match. Campaign numbers feel inconsistent. Teams spend more time reconciling data than using it. A data pipeline brings order to this confusion. It collects information from different systems, prepares it for use, and delivers it in a form that teams can trust. The cost reflects how difficult that process is in your specific case. At Product Siddha, the first step is not quoting a number. It is understanding how data moves within the business. Without that clarity, any estimate risks being inaccurate. What You Are Actually Building A marketing data pipeline is not a single tool. It is a structured system made up of several parts working together. Most pipelines include: Data sources such as advertising platforms, CRM systems, and websites Data ingestion processes that pull data at regular intervals Transformation layers where raw data is cleaned and organized Storage systems such as data warehouses Reporting layers including dashboards and analytics tools Each layer introduces effort. Each layer also influences the final cost. A Realistic Cost Structure The cost of building a custom pipeline can be understood in three stages. These ranges reflect typical mid-market implementations. 1. Setup and Integration This stage connects all your data sources and establishes the pipeline. Estimated cost: ₹1.5L to ₹5L If your business uses multiple platforms, integration becomes more involved. Each system has its own format and behavior. Some require custom API handling. Others may have limitations that need workarounds. 2. Data Cleaning and Transformation Raw data rarely works as it is. It must be structured, validated, and aligned. Estimated cost: ₹1L to ₹4L This stage often takes more time than expected. Naming inconsistencies, duplicate records, and missing fields require careful correction. If this step is rushed, reporting accuracy suffers later. 3. Dashboard and Reporting Layer This is the interface your team interacts with. Estimated cost: ₹50K to ₹2.5L Simple dashboards with basic metrics are faster to build. More advanced reporting, such as full funnel tracking or segmented views, increases the effort. Total Investment Range Here is a simplified view of overall costs: Complexity Level Estimated Cost Basic Pipeline ₹2.5L – ₹5L Mid-Level Pipeline ₹5L – ₹10L Advanced Pipeline ₹10L+ These figures vary depending on business needs, but they provide a realistic starting point. What Drives These Costs Several factors influence where your project will fall within these ranges. Number of Data Sources More platforms mean more integration work. Each source adds complexity. Data Volume Higher data volumes require stronger infrastructure and better optimization. Processing Type Real-time pipelines cost more due to their technical demands. Batch processing is simpler and more cost-effective. Custom Requirements If you need user-level tracking, advanced attribution, or predictive insights, the pipeline becomes more complex. Team Expertise An experienced team may charge more upfront, but it often prevents costly revisions later. A Practical Example In the case of Product Analytics and Full-Funnel Attribution for a SaaS Coaching Platform, the main challenge was not collecting data. The issue was connecting user behavior across different stages. The solution required building a structured pipeline that tracked users from acquisition to conversion. Events had to be mapped carefully, and data had to be transformed consistently. Once implemented, the team gained clear visibility into which channels were actually driving results. This level of clarity often offsets the initial investment. Another Scenario Worth Noting In Built Custom Dashboards by Stage, the requirement was different. The focus was not on a single unified dashboard, but on multiple views tailored to different teams. Each stage of the funnel had its own reporting logic. This increased the effort during setup, but it made the system more usable in practice. Teams could focus on relevant metrics without sorting through unnecessary data. The added clarity improved day-to-day decision making. Costs That Are Easy to Miss Initial setup is only part of the investment. Ongoing costs should also be considered. Monitoring and maintenance Updates when third-party APIs change Infrastructure scaling as data grows Training teams to use the system effectively Ignoring these elements often leads to underestimating the true cost. Build vs Ready-Made Tools Many businesses consider using standard tools instead of building a custom pipeline. Pre-built tools offer speed and lower upfront cost. However, they may not fit every use case. Custom pipelines take longer but provide greater control. In HubSpot Marketing Hub Setup for a Growing Fintech Brand, a hybrid approach was used. Standard tools handled core functions, while custom integration ensured data consistency across systems. This approach balanced cost with flexibility. When Does Investment Make Sense A custom data pipeline becomes valuable when: Data exists across multiple platforms Reporting takes too long to produce Teams rely on incomplete or inconsistent information Existing dashboards are not trusted In such situations, the cost of not fixing the problem can be higher than the investment required. Custom vs Standard Approach Aspect Custom Pipeline Standard Tools Flexibility High Limited Setup Time Longer Shorter Cost Higher upfront Lower upfront Scalability Strong Tool-dependent Control Full Restricted A Measured Perspective Cost alone does not tell the full story. Value matters more. A well-designed pipeline reduces manual work, improves data accuracy, and allows faster decision making. Over time, these gains accumulate. Product Siddha focuses on building systems that remain stable as the business grows. This reduces the need for repeated rebuilding and helps teams rely on their data with confidence. Final Thoughts There is no fixed price for a custom marketing data pipeline. The cost depends on your systems, your data quality, and your business requirements. What matters is having a clear understanding of what you need and why. With that clarity, the investment becomes easier to evaluate. A structured approach, supported by practical examples and careful execution, ensures that the pipeline delivers lasting value rather than short-term fixes.

AI Automation, Blog

How to Justify AI Automation Investment to Your Leadership Team

How to Justify AI Automation Investment to Your Leadership Team Making the Case Convincing a leadership team to invest in AI automation requires more than enthusiasm. Senior decision makers expect clarity, numbers, and a direct link to business outcomes. A well-prepared case speaks in terms they trust – cost, efficiency, risk, and long-term value. A skilled product consultant understands this balance. The role is not limited to suggesting tools. It involves shaping a clear argument that connects automation efforts with measurable business results. This is where many proposals fail. They focus on capability instead of consequence. This guide outlines a practical way to present AI automation as a sound business decision. Start with a Defined Problem Leadership teams respond better to problems than to possibilities. Begin by identifying a specific operational issue. For example, slow lead response time, manual reporting delays, or repeated data entry tasks. Describe the current state in simple terms. Show how it affects revenue, team productivity, or customer experience. In one engagement involving a real estate platform, the gap was clear. Leads were generated in volume, but follow-up was inconsistent. This resulted in missed site visits and lost opportunities. The automation effort was framed around solving that precise issue. When the problem is clear, the investment becomes easier to understand. Translate Automation into Financial Terms A proposal gains strength when it connects directly to financial outcomes. Break down the expected impact into three areas: Cost reduction Revenue improvement Time savings For instance, if automation reduces manual work by 20 hours per week, convert that into cost savings over a year. If faster response improves conversion rates, estimate the added revenue. A product consultant often builds simple financial models to support this step. These models do not need to be complex. They need to be credible and easy to follow. Use Real Examples to Build Confidence Leadership teams trust evidence more than projections. In the case of From Lead to Site Visit – Voice AI Automation for a Real Estate Platform, automation improved response time and increased qualified site visits. The outcome was not limited to efficiency. It directly influenced revenue flow. These examples show that AI automation is not an abstract concept. It delivers measurable improvements when applied with care. Clarify the Scope of Investment Unclear scope often leads to hesitation. Define what the investment includes: Tools and platforms Implementation effort Ongoing maintenance Training and support A product consultant helps structure this clearly. Leadership teams prefer predictable commitments over open-ended initiatives. It also helps to present the investment in phases. A smaller initial rollout reduces perceived risk and allows room for learning. Address Risk and Uncertainty Every investment carries risk. Ignoring it weakens the proposal. Discuss possible challenges such as integration issues, adoption delays, or data quality concerns. Then explain how these risks will be managed. In AI Automation Services for Agri-Tech/FoodTech VC Fund, early concerns included data inconsistency and process variation. The approach focused on cleaning data and standardizing workflows before automation. This reduced failure risk and improved outcomes. A balanced view builds trust. Show Impact on Teams, Not Just Systems Automation changes how teams work. Leadership teams care about this impact. Explain how roles will evolve. Will repetitive tasks reduce? Will decision making improve with better data? In Built Custom Dashboards by Stage, the benefit was not limited to reporting. Teams gained visibility into performance at each stage, which improved accountability and decision speed. This human angle often makes the difference in approval discussions. Before and After Automation Area Before Automation After Automation Lead Response Delayed and inconsistent Immediate and structured Reporting Manual and time-consuming Real-time dashboards Data Accuracy Prone to errors Standardized and reliable Team Efficiency Repetitive tasks Focus on high-value work Tables like this simplify complex changes. Build a Phased Roadmap Large investments are easier to approve when broken into stages. Start with a pilot project. Measure results. Use those results to justify further expansion. For example, in Product Analytics for a Ride-Hailing App with Mixpanel, the initial focus was on key user actions. Once insights improved decision making, the scope expanded to full funnel tracking. This step-by-step approach reduces resistance. Align with Business Priorities AI automation should not exist as a separate initiative. It must support existing business goals. If the company is focused on growth, highlight revenue impact. If efficiency is the priority, focus on cost and time savings. Product Siddha plays a key role here. They connect technical capabilities with business direction, ensuring that automation efforts are not isolated. A Grounded Perspective At its core, justifying AI automation is about clarity. Leadership teams are not opposed to new investments. They are cautious about unclear ones. A well-structured case answers three questions: What problem are we solving What value will we gain What risks are involved When these answers are supported by real examples and practical reasoning, the conversation changes. It shifts from approval seeking to informed decision making. AI automation is not a trend to follow. It is a tool to solve defined problems and improve how businesses operate. The responsibility lies in presenting it with care, discipline, and evidence. With the right approach, and with guidance from an experienced Product Siddha, organizations can move forward with confidence and avoid costly missteps.

Blog, Product Management

Before You Hire a Product Consultant: 12 Questions That Save You Lakhs

Before You Hire a Product Consultant: 12 Questions That Save You Lakhs The Cost of a Wrong Hire Hiring a product consultant is not a small decision. In many cases, the engagement runs into several lakhs within a few months. What often goes unnoticed is the cost of wrong direction. A consultant who builds the wrong roadmap, tracks the wrong metrics, or ignores user behavior can quietly drain time, budget, and team morale. A good product consultant does not just give advice. They shape how decisions are made, how features are prioritized, and how growth is measured. This is why asking the right questions before hiring matters far more than reviewing a polished proposal. Below are twelve questions that can help you avoid expensive mistakes and find the right partner for your business. 1. How do you approach product discovery? A capable product consultant will not jump straight into solutions. They begin with understanding users, business goals, and constraints. Ask how they validate ideas before development. Look for mention of user interviews, data analysis, and problem framing. If the answer sounds like a fixed process applied to every company, that is a warning sign. 2. Can you share a real example of solving a similar problem? Experience should be specific, not generic. For example, Product Siddha worked on Building a Lead Engine After Apollo Shut Us Out. Instead of relying on a single tool, they designed a multi-channel system that reduced dependency risk and improved lead flow stability. This kind of example shows problem solving under constraints, which is far more useful than standard success stories. 3. What metrics do you track to measure success? A strong product consultant focuses on meaningful metrics, not vanity numbers. They should speak about activation, retention, conversion rates, and revenue impact. If the conversation stays limited to traffic or downloads, the engagement may not deliver business outcomes. 4. How do you balance product intuition with data? Good product decisions sit between instinct and evidence. In one case, Product Siddha handled Product Analytics & Full-Funnel Attribution for a SaaS Coaching Platform. Instead of relying only on dashboards, they combined user journey data with founder insights to refine the funnel. This balance is critical. Too much data can slow decisions. Too much intuition can lead to bias. 5. What tools and systems do you work with? A consultant should be comfortable with modern analytics and marketing tools, but the focus should remain on outcomes. For instance, in Driving Growth for a U.S. Music App with Full-Stack Mixpanel Analytics, the use of Mixpanel was not the highlight. The real value came from identifying user drop-offs and improving engagement loops. The tool matters less than how it is used. 6. How do you prioritize features? Feature prioritization often decides the success or failure of a product. Ask how they choose what to build first. Look for structured thinking such as impact versus effort, user value, and alignment with business goals. Avoid consultants who rely only on founder requests or competitor features. 7. How do you handle unclear requirements? In early-stage or fast-moving companies, clarity is rare. A reliable product consultant should be comfortable working with incomplete information. They should explain how they break down ambiguity into smaller, testable steps. For example, in Building the World’s First AI-Powered Networking Assistant, the initial scope was broad. The approach focused on iterative validation instead of building everything at once. 8. Can you explain a failure and what you learned from it? This question reveals honesty and depth. Every experienced consultant has faced setbacks. What matters is how they learned and adapted. If the answer avoids failure entirely, it is unlikely to be genuine. 9. How do you work with internal teams? A product consultant should not operate in isolation. They must collaborate with developers, marketers, and leadership. Ask how they communicate progress, resolve conflicts, and ensure alignment. In HubSpot Marketing Hub Setup for a Growing Fintech Brand, success depended on aligning marketing and product teams around shared data and workflows. 10. What does your typical engagement look like? Clarity in process helps avoid confusion later. Ask about timelines, deliverables, and involvement levels. A vague answer often leads to scope creep and missed expectations. 11. How do you ensure long-term impact? The goal is not short-term fixes. It is building systems that continue to deliver value. For example, in Built Custom Dashboards by Stage, the focus was on creating visibility across the funnel so that teams could make informed decisions even after the engagement ended. 12. What will you need from us to succeed? This question shifts the focus to collaboration. A good product consultant will clearly state what they expect from your team. This may include access to data, regular check-ins, or decision-making support. If the answer suggests they can handle everything independently, it may lead to misalignment later. Good vs Poor Product Consultant Criteria Strong Consultant Weak Consultant Discovery Approach User and data driven Assumption based Metrics Focus Business outcomes Vanity metrics Communication Clear and structured Irregular and vague Flexibility Adapts to context Uses fixed templates Impact Builds systems Delivers one-time outputs Final Thoughts Hiring a product consultant is a strategic decision. The right choice can accelerate growth and bring clarity to complex problems. The wrong one can slow progress and increase costs without visible results. These twelve questions are not just a checklist. They are a way to understand how a consultant thinks, works, and collaborates. When answered well, they reveal far more than any proposal or presentation. Take your time with this process. A careful evaluation today can save lakhs tomorrow.

AI Automation, Blog

Why Co-Living Companies Need Custom Software

Why Co-Living Companies Need Custom Software Co-living has grown into a distinct segment of the housing market. Young professionals, students, and remote workers increasingly prefer flexible housing with shared services. Property operators now manage multiple buildings, rotating tenants, and various amenities under one business model. Yet many co-living companies still rely on generic property tools or spreadsheets. These tools were originally designed for traditional apartment management. Shared living operations require a different structure. This is where a Custom Software Development Company becomes valuable. Instead of forcing a business to adapt to generic software, a tailored system supports the exact workflow of co-living operations. For companies managing shared housing communities, the difference is practical and immediate. A Different Type of Housing Business Co-living operations differ from conventional rental management in several ways. Residents typically stay for shorter periods. New tenants arrive every few weeks. Services such as housekeeping, internet access, events, and maintenance must be coordinated across many units. Traditional property systems usually focus on long leases and simple rent collection. They rarely track shared services or community activity. As co-living portfolios grow, operational complexity increases. A Custom Software Development Company can design systems that reflect the actual structure of shared living operations. These systems track tenants, services, payments, and property usage in one environment. Operational Challenges in Co-Living Co-living companies often encounter similar operational issues. Challenge Operational Impact Frequent tenant turnover Manual onboarding and offboarding Shared services management Difficulty tracking service requests Multi-property coordination Limited visibility across locations Tenant communication Messages scattered across platforms When these activities are managed manually, staff spend significant time on administrative tasks. Custom systems simplify these operations. Why Generic Property Software Falls Short Standard property management tools usually assume a simple relationship between landlord and tenant. Co-living companies operate in a different environment. Residents may change rooms, extend short stays, or participate in shared activities. Amenities must be scheduled and tracked across multiple users. Generic systems cannot easily represent these patterns. A Custom Software Development Company can build platforms that handle: room level occupancy tracking flexible lease durations service subscriptions community event management integrated payment records This structure allows staff to manage operations without juggling multiple systems. Resident Experience Matters Co-living communities depend on resident satisfaction. Many tenants choose shared living for convenience and social interaction. A digital platform designed for co-living can improve the resident experience in several ways. Residents may use a mobile portal to: reserve shared spaces submit maintenance requests manage rent payments communicate with community managers When these services operate smoothly, the property feels organized and professional. A Custom Software Development Company can develop resident portals tailored to the exact services offered by a co-living brand. Example of Operational Transformation The importance of tailored software appears in several industries where operational complexity increases with growth. One relevant case documented by Product Siddha involves Product Management for UAE’s First Lifestyle Services Marketplace. The platform combined several service categories within one digital system. Users needed a unified interface to browse services, schedule appointments, and track activity. Although the marketplace operated in a different sector, the challenge resembles the situation faced by co-living operators. Multiple services must be coordinated within a single environment. By designing custom product workflows, the system could manage service listings, user engagement, and operational data more effectively. The lesson for co-living operators is clear. When a business offers several services under one roof, standard tools rarely provide the required flexibility. Custom platforms provide better alignment with day to day operations. Core Modules in Co-Living Software A well designed platform for shared housing typically includes several integrated modules. Module Function Tenant Management Track residents, room assignments, and lease duration Billing and Payments Manage rent, deposits, and service subscriptions Maintenance Requests Record and track service issues Community Events Organize resident activities Property Analytics Monitor occupancy and revenue These modules form the foundation of a digital operations system. A Custom Software Development Company can expand these modules as the business grows. Co-Living Software Architecture Tenant Onboarding ↓ Room Allocation ↓ Billing and Payments ↓ Service Requests ↓ Community Engagement ↓ Operational Analytics This simple structure allows managers to view the entire lifecycle of a resident. Benefits for Growing Operators Custom software offers several advantages to co-living businesses. Operational Efficiency Staff spend less time updating spreadsheets or searching for information. Most operational records appear within one dashboard. Data Visibility Managers can monitor occupancy rates, service usage, and revenue patterns. Consistent Resident Communication Messages, service updates, and announcements reach residents through one system. Scalable Infrastructure As the property portfolio expands, the platform grows alongside the business. These improvements help operators focus on building communities rather than managing paperwork. The Role of a Custom Software Development Company Developing software internally can be difficult for real estate operators. Most co-living companies specialize in property management rather than software engineering. Working with a Custom Software Development Company provides access to experienced product teams. These teams design platforms that match operational workflows. A firm such as Product Siddha works closely with businesses to understand their operational structure. Developers and product managers then translate those requirements into a structured digital platform. This collaboration ensures that the software supports real operations rather than forcing the company to change its processes. A Foundation for the Future Shared housing continues to evolve. New services appear as resident expectations change. Co-living operators who rely on manual tools often struggle to keep pace with this growth. Digital systems designed specifically for shared living offer a stable foundation. A platform built by a Custom Software Development Company allows co-living companies to manage properties, coordinate services, and support residents within a single environment. As portfolios expand and communities grow larger, the value of such systems becomes increasingly clear. Custom software does not simply automate tasks. It organizes the entire operational structure of a modern co-living business.

Blog, Product Management

Why Investors Care More About Retention Than Signups

Why Investors Care More About Retention Than Signups In the early life of a startup, growth numbers often receive the most attention. Founders celebrate rising signup counts. Dashboards display daily registrations and user acquisition charts. These figures appear impressive during product launches and press announcements. Investors, however, study a different signal. They want to know whether users remain active after the first visit. Signups show curiosity. Retention shows value. A product that attracts thousands of new users but loses them within days rarely builds a sustainable company. A smaller product that keeps its users engaged often attracts serious investment. This difference explains why investors place greater importance on user retention metrics than on raw signup totals. Looking Beyond the First Click A signup represents the beginning of a relationship with a product. It does not guarantee that the user will return. Many startups experience an early surge of registrations followed by rapid decline in activity. This pattern appears when marketing efforts bring visitors who are only exploring. Investors prefer to see signs of consistent usage. These signs include: repeat visits to the product regular interaction with core features gradual increase in user engagement These patterns indicate healthy product retention rates. They show that the product solves a real problem rather than attracting temporary interest. The Difference Between Growth and Stickiness Two metrics often appear together in startup reports. Metric What It Measures Signups Number of new users joining Retention Percentage of users returning Signups describe the speed at which people discover a product. Retention describes the strength of the product experience. Investors evaluate both numbers together. A product with steady customer retention metrics signals long term potential. Example Scenario Imagine two startups launching similar software tools. Startup A gains 50,000 signups during its first three months. After one week only 5 percent of those users remain active. Startup B attracts 8,000 signups during the same period. After one week 60 percent continue using the product. Although Startup A appears larger, investors usually prefer Startup B. Strong user retention analytics suggest that the product has real market fit. Why Retention Predicts Revenue Sustainable businesses depend on repeated usage. When customers continue using a product, several positive outcomes follow. Subscription payments continue Users recommend the product to others Customer support costs decrease Product data becomes more reliable These effects strengthen customer lifetime value, which investors examine carefully when evaluating a startup. A product that retains users often grows through natural referrals. This pattern reduces the cost of acquiring each new customer. Measuring Retention Correctly Product teams measure retention using several time based methods. Retention Period Purpose Day 1 Retention Checks if users return after the first visit Week 1 Retention Measures early product engagement Month 1 Retention Indicates long term interest These figures form the basis of product retention analysis. Data teams track the percentage of users who return during each period. The results reveal whether the product continues to provide value. Learning from Product Analytics Retention data becomes meaningful only when it connects to user behavior. Product analytics tools help teams understand what users actually do inside the product. One example appears in the case study titled “Driving Growth for a U.S. Music App with Full Stack Mixpanel Analytics.” In this project, analysts examined how listeners interacted with the music platform. The data showed specific points where users stopped listening or left the application. These drop off moments indicated friction in the user experience. After the product team simplified navigation and improved playlist discovery, engagement increased. As retention improved, the product gained stronger evidence of market demand. This example reflects how companies such as Product Siddha apply product analytics and retention tracking to guide product decisions. A Visual Look at Retention Suggested infographic for the article: New Users ↓ First Product Experience ↓ Repeat Visits ↓ Regular Usage ↓ Long Term Customer This path illustrates how a casual visitor becomes a committed user. The Investor Perspective Investors examine retention numbers because they reveal several important characteristics of a startup. Product Market Fit High retention suggests that the product solves a meaningful problem. Users continue returning because the product fits naturally into their daily routine. Efficient Growth When users stay active, growth becomes easier. Returning customers often invite colleagues or friends, creating organic expansion. Reliable Forecasting Retention provides stable revenue projections. Investors can estimate future earnings when customers maintain regular subscriptions. These factors make startup retention metrics a central part of investor evaluation. Real World Example A familiar example comes from the early development of Slack. Before the company became a global workplace communication platform, the founders observed that teams who tried the product often continued using it every day. Daily usage remained extremely high within organizations. This pattern demonstrated strong user engagement and retention. Investors recognized that behavior as a signal of deep product value. The product expanded rapidly after those early indicators appeared. Improving Retention in Practice Founders often ask how to improve retention once a product launches. The answer usually begins with careful observation of user behavior. Product teams often focus on three areas. Clear First Experience New users should quickly understand how the product helps them. Confusion during the first session often leads to abandonment. Reliable Performance Slow loading times and technical errors discourage repeat visits. Stable infrastructure supports better user retention performance. Continuous Product Learning Analytics data should guide product updates. When teams observe where users struggle, they can refine the experience gradually. Companies that follow these steps often see steady improvements in retention. Data That Guides Product Decisions The following chart illustrates common retention indicators used by product teams. Indicator Insight Active users Overall product engagement Session frequency How often users return Feature usage Most valuable product tools Churn rate Percentage of users leaving Together these metrics form a clear picture of product health. Final Insight Signups create the first spark of growth for a startup. They show that people are curious enough to try the product. Yet curiosity alone does not build a durable